A Separation and Detection Scheme for Environmental Colloids
The presence of colloids in natural waters is one of the major
reasons for discrepancies between experimental findings and
theoretical predictions of contaminant transport via the water
path. Here, particles of 1 nm to 1 µm are regarded as colloidal
particles. We developed a scheme of separation and detection
for colloidal particles which is applicable to very different
natural waters. A minimum of influences on the samples and a
maximum of unambiguousness of the measurements is striven for
by this scheme. Separation steps are performed as mildly as
practicable or, if possible, avoided at all. Separation
procedures are centrifugation and mild filtration. Detection
methods are scattered light intensity measurements, photon
correlation spectroscopy (PCS), ICP-MS, AAS, TOC analysis and
imaging by scanning electron microscopy (SEM), i.e., non-
invasive as well as invasive methods. An important element of
this scheme is the parallel application of as many
complementary methods as possible. It allows to achieve
validation of the results "against each other" and increases
the probability to recognize artifacts.
Our first step in solving a colloid characterization problem is
always a non-invasive particle size measurement by PCS on the
raw sample. The next operation is a PCS measurement on a 5-µm
filtrate of this sample. Filtration through 5-µm Nuclepore
filters improves the counting statistics for PCS but has
usually only little influence on the colloidal inventory of the
sample. Fig. 1 shows PCS results for a water sample from a mine
drainage tunnel (colloid concentration 1 mg/L).
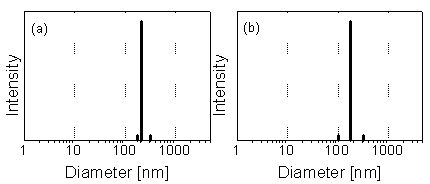
Fig. 1: Particle size distribution in water from the drainage tunnel Rothschönberger Stolln (Freiberg) according to PCS. (a) Raw sample. (b) 5-µm filtrate. Colloid concentration: about 1 mg/L. Particles of 50 to 300 nm with the peak maximum at 180 nm are found (c.f. [1]).
Particles of
about 100 nm as those indicated in Fig. 1 can also easily be
visualized by SEM when laying on a Nuclepore filter. Examples
from a mine drainage tunnel water sample, an acid rock drainage
(ARD) sample, a bog water sample and a backwater sample from a
sanitary landfill are given in Figures 2 through 5 [1-4].
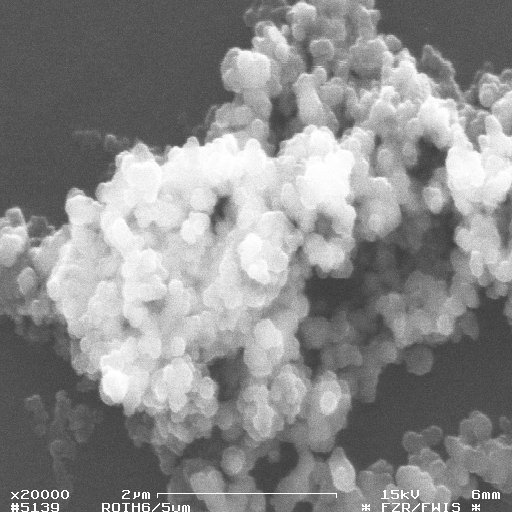
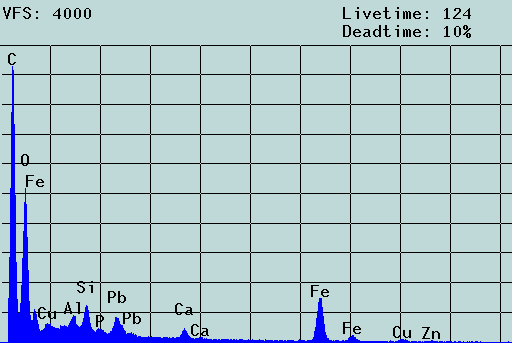
Fig. 2. SEM micrograph and EDX spectrum of an agglomerate of colloidal particles from the mine drainage tunnel Rothschönberger Stolln (colloid concentration: about 1 mg/L) laying on a 5-µm Nuclepore filter. Scale bar: 2 µm. The filter cake was washed three times, dried and coated with carbon. The aggregate consists of iron/aluminum oxyhydroxide particles of 100 to 300 nm that carry toxic heavy metal contaminants. In the solution, these particles move freely, i.e., the aggregate results from the filtration process (c.f. [1]).
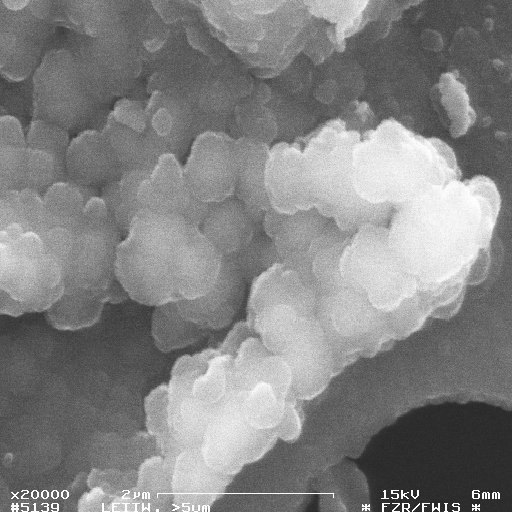
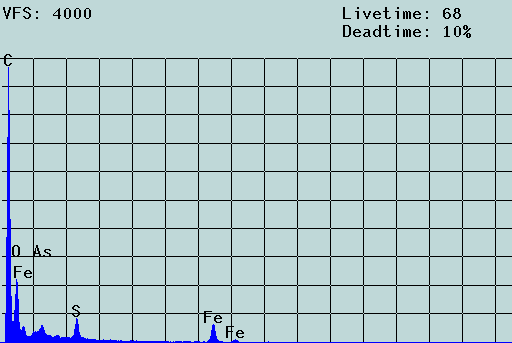
Fig. 3: SEM micrograph and EDX spectrum of an agglomerate of colloidal particles from acid rock drainage (ARD) from Freiberg (colloid concentration: about 1 g/L) laying on a 5-µm Nuclepore filter. Scale bar: 2 µm. The filter cake was washed three times, dried and coated with carbon. The aggregate is formed of particles of 70 to 250 nm. Chemically, these particles consist of iron oxyhydroxides which also contain toxic heavy metal contaminants. In the solution, these particles move freely, i.e., the aggregate results from the filtration process (c.f. [2]).
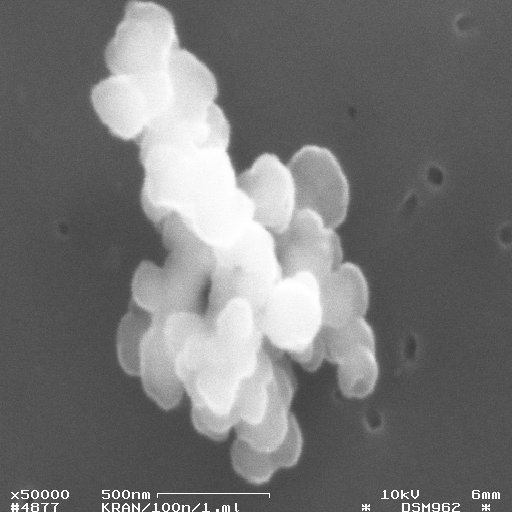
Fig. 4: SEM micrograph of humic particles from the mountain bog Kleiner Kranichsee (colloid concentration: 140 mg/L) laying on a 100-nm Nuclepore filter. Scale bar: 500 nm. The filter cake was washed three times, dried and coated with carbon. The aggregate consists of particles of about 200 nm. In the solution, these particles move freely, i.e., the aggregate results from the filtration process (c.f. [3]).
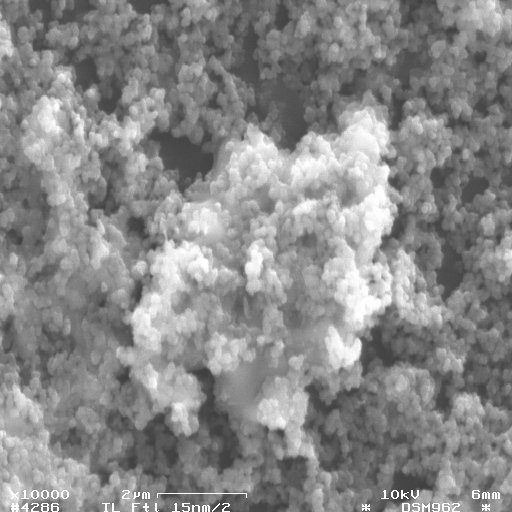
Fig. 5: SEM micrograph of inorganic particles from the backwater of a sanitary landfill at Freital, Saxony (colloid concentration: 1 to 2 mg/L) laying on a 15-nm. Scale bar: 2 µm. The filter cake was washed three times, dried and coated with carbon. It consists of particles of 50 to 300 nm. In the solution, these particles move freely, i.e., the aggregate in the center of the figure results from the filtration process (c.f. [4]).
In all these samples we found good agreement between the PCS
results and the SEM particle sizes. Whereas it is not possible
to decide from the SEM micrographs alone if the micron-sized
aggregates visible on the filters exist also in the solutions,
the in-situ measurements by PCS prove that these aggregates are
formed by the filtration process. The nanoparticles of the 100-
nm size range move usually freely (independently of each other)
in the unperturbed solution. The minimum colloid concentration
detectable by PCS for particles of about 100 nm is 10 to 100
µg/L. The chemical composition of such particles can be
determined by filtration and by ICP-MS and EDX of the filter
cakes.
A significantly more difficult problem is the non-invasive or
little-invasive determination of particles of only few
nanometers in diameter. The minimum concentration detectable by
PCS is much higher for such particles because these particles
scatter very little light. The presence of only few larger
particles prevents PCS because they optically mask the small
particles. The small particles can be unmasked by removing the
larger particles using filtration or centrifugation. An
unmasking experiment on an ARD sample (colloid concentration
about 1 g/L) is shown in Fig. 6 (cf. [5]).
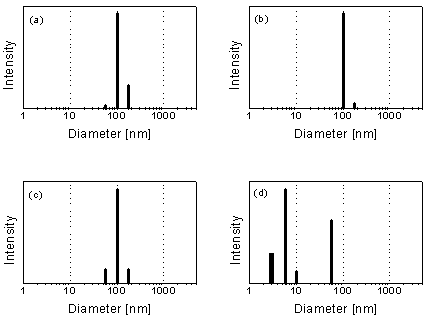
Fig. 6: Particle size distribution in an acid rock drainage (ARD) sample from Freiberg (colloid concentration: about 1 g/L) according to PCS. (a) Raw sample. (b) 5-µm filtrate. (c) 400-nm filtrate. (d) 50-nm filtrate. Filtration through sufficiently small filter pores results in the unmasking of the ultrafine colloid particles (c.f. [5]).
Light scattering
intensity measurements, PCS, and chemical analyses by ICP-MS,
TOC analysis, ion chromatography etc. should be combined to
identify the colloid inventories and the colloid
composition/mineralogy of such complex colloid mixtures in
centrifugation or filtration experiments, and one should always
be aware of the artifacts that can be caused by centrifugation
and especially by filtration (self-coagulation, clogging,
adsorption etc.). Fig. 7 demonstrates the particle size
characterization of organic particles in a bog water sample
down to about 1 nm by ultrafiltration (concentration of the
organic particles: about 14 mg/L) [6].
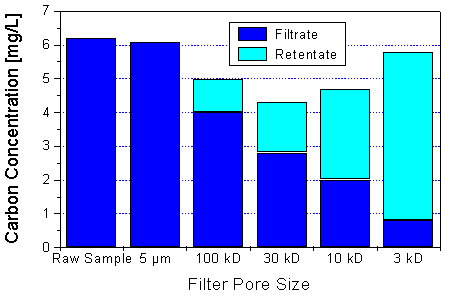
Fig. 7: Ultrafiltration of a water sample from the bog Kleiner Kranichsee, Saxony. Colloid concentration: about 14 mg/L. Decreasing amounts of humic material are passing through the ultrafilters with decreasing molecular weight cut-off. The sums of the filtrate and the retentate concentrations show that the recovery of the ultrafiltration process is reasonable (the poorest recovery was found for the 30-kD ultrafilter). Cf. [6].
Also extremely fine iron
oxyhydroxide particles in ARD (colloid concentration about 1
g/L) [5] and fine particles in wood degradation products and in
lignin solutions (colloid concentration about 2 g/L) [7] could
be characterized by ultrafiltration. The visualization of
particles of less than 10 nm in size is possible by
transmission electron microscopy (TEM) and atomic force
microscopy (AFM). However, sample preparation is tedious for
these methods; the techniques, although challenging and very
promising, are hardly suited as routine techniques. An example
is given in Fig. 8. It shows the result of an experiment in
which we could visualize the individual molecules of a humic
acid solution spin-coated onto mica by AFM (collaboration with
the Dresden University of Technology). SEM is not suited to
visualize such particles because of lack of resolution power.
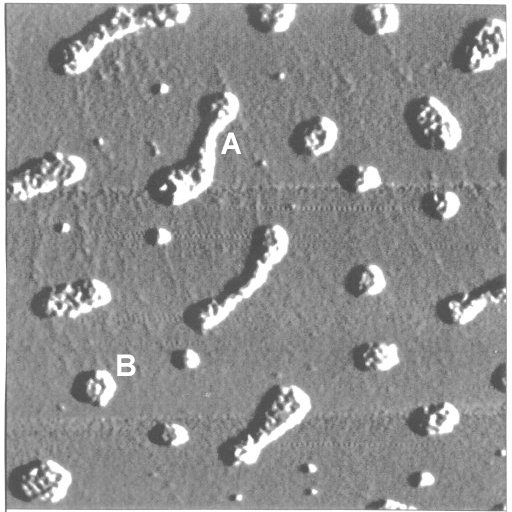
Fig. 8: AFM image of humic acid deposited on mica by means of spin-coating. Concentration of the spin-coated humic acid solution: 200 mg/L, pH value: 11.3. Scan size: 1 µm x 1 µm. Elongated agglomerates (A - 250 nm x 60 nm) and disk-like agglomerates (B - 50 nm diameter) are visible. Height of the deposits: 1.5 to 2 nm. Periodicity of the substructure: 12 to 14 nm. The agglomerates are monolayer clusters of 'humic acid subunits'. The 'subunits' could be identified as the individual humic acid molecules. AFM image taken by M. Mertig, Dresden University of Technology.
A real challenge to our separation and detection scheme is the
investigation of extremely fine low-concentration colloids (few
nanometers and few mg/L). Particle size determination by PCS
fails in such cases because of poor counting statistics due to
low scattered light intensities and because of masking
problems. Ultrafiltration is often disturbed by adsorption
problems at the filter membranes. For inorganic particles (Fe
and Al oxyhydroxide particles), we reached the lowest detection
limits by centrifugation. Using centrifugal accelerations of up
to 46 000 g and centrifugation times of up to 10 h, we were
able to classify colloidal particles down to about 5 nm in
diameter at concentrations of about 0.5 mg/L [8]. Fortunately,
low-concentration colloids do usually not play an important
role in contaminant transport via the water path as has for
instance been demonstrated for groundwaters from crystalline
rock formations in Switzerland [9]. The surface area of the
particles of low-concentration colloids is too low in
comparison to the available rock surface to take real
influence. Extremely fine particles in particular tend to be
low-concentrated in the nature due to high instability if they
are not stabilized electrostatically (as it is the case in
humic acid solutions or in ARD solutions). This instability is
caused by the very fast coagulation kinetics of environmental
particles of the lower nanometer size range [10].
References
- Richter, W., Zänker, H., Nitsche, H.:
Characterization of Colloid Particles in Mining Water (Rothschönberger Stolln).
Report FZR-247. Annual Report 1998 of Institute of Radiochemistry. Forschungszentrum Rossendorf, January 1999. p. 61.
- Richter, W., Zänker, H., Hüttig, G.:
Characterization of Colloid Particles in Acid Rock Drainage From the Mine at Freiberg, Saxony.
Annual Report 1999 of Institute of Radiochemistry. Forschungszentrum Rossendorf 2000.
- Zänker, H., Richter, W., Hüttig, G., Nitsche, H.:
Particle Growth Phenomena in Filtered Bog Water.
Report FZR-218. Annual Report 1997 of Institute of Radiochemistry. Forschungszentrum Rossendorf, May 1998. p. 75.
- Zänker, H., Hüttig, G., Moll, H., Nitsche, H.:
Comparison of Methods for Colloid Particle Sizing: Filtration, Centrifugation, Photon Correlation Spectroscopy (PCS), and Scanning Electron Microscopy (SEM).
Report FZR-280. Annual Report 1996 of Institute of Radiochemistry. Forschungszentrum Rossendorf, May 1997. p. 47.
- Zänker, H., Richter, W., Brendler, V., Kluge A., Hüttig, G.:
Ultrafine Colloid Particles in Acid Rock Drainage (ARD).
Annual Report 1999 of Institute of Radiochemistry. Forschungszentrum Rossendorf 2000.
- Schmeide, K., Zänker, H., Heise, K. H., Nitsche H.
Isolation and Characterization of Humic Substances from the Bog "Kleiner Kranichsee".
In: 1st Technical Progress Report of the EC Project
'Effects of Humic Substances on the Migration of Radionuclides: Complexation and Transport of
Actinides'. Project Nr. FI4W-CT96-0027 (ed. G. Buckau). Report FZKA 6124. Forschungszentrum
Karlsruhe, August 1998, p. 161.
- Richter, W., Zänker, H., Nitsche, H.:
Lignin Colloids in Aqueous Solution.
Report FZR-218. Annual Report 1997 of Institute of Radiochemistry. Forschungszentrum Rossendorf, May 1998. p. 76.
- Zänker, H., Hüttig, G., Arnold, T., Zorn, T., Nitsche, H.:
Detection of Iron and Aluminum Hydroxide Colloids in a Suspension of Ground Phyllite.
Report FZR-247. Annual Report 1998 of Institute of Radiochemistry. Forschungszentrum Rossendorf, January 1999. p. 64.
- Degueldre, C. A.:
Colloid Properties in Groundwaters from Crystalline Formations.
Report PSI 94-21. Paul Scherrer Institut Villigen, Sep 1994.
- Fillela, M., Buffle, J.:
Factors controlling the stability of submicron colloids in natural waters.
Colloids and Surfaces A 73, 255 (1993).
 |
 |