|
In the course of the experiments with the two-arm DISTO [1] spectrometer at the SATURNE
accelerator in Saclay the exclusive production of w mesons was measured at excess
energies Q = 89, 207, and 320 MeV (Q = Ös-Ö[(s0)]).
These beam energies are well suitable to close the considerable gap between the near-threshold data
obtained in SPEC III experiments [2] at excess energies Q < 30 MeV and data at larger
Q > 400 MeV (see e.g. [3]).
Data at the highest beam energy in DISTO experiments were analyzed and published
so far [4-7].
The investigation of all data is still in progress.
In this contribution first preliminary results
on the analysis of the data at the lowest excitation energy for the w meson are
presented.
The exclusive reactions pp®pph and pp®ppw were identified via the
three pion decay (i.e. h, w® p+ p- p0), where the braching ratios are
taken from [8].
Only events with one negative and three positive charged particles were used in the data processing
of h and w mesons.
A good separation was achieved for p+ and p, also the p- was clearly observed as shown in
[4-6]
using the light signal from the water filled Cerenkov detectors together with the particle momentum.
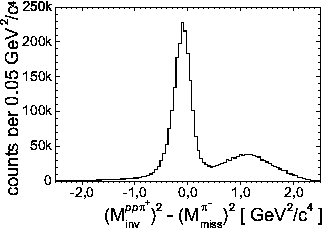
Fig. 1 shows the (Mppp+inv)2 - (Mp-miss)2 distribution, whereas
the symbol (Mxinv/miss) denotes the invariant or the missing mass of the particle or particle
combination x.
In Monte Carlo simulations only the region above 0.4 (GeV/c2)2 was populated with h and
w mesons.
Therefore, this behavior was used to suppress pure 4 body events (ppp+ p-) in the data analysis,
which are peaked at (Mppp+inv)2 - (Mp-miss)2 = 0 (GeV/c2)2.
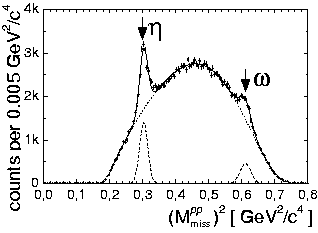
To improve the resolution of the (Mppp+p-miss)2 spectrum a kinematical refit
assuming a missing p0 meson was applied in a second fit procedure.
The spectrum after this refit is shown in Fig. 2. The arrows depict the expected positions
for the mesons taken from [8].
The main source of the remaining background is the non-resonant p+ p- p0 production.
Unfortunately, the exact form of the background is unknown.
Therefore, the spectrum was fit with Gauss peaks for the h and w signals
and the background was parametrized with a polynomial of third order and a wide Gaussian curve.
In Fig. 2 are also depicted the fit result (full), the h and w
peak (dashed), and the background (dotted), respectively.

|

|
|
Fig. 1 Distribution of (Mppp+inv)2 - (Mp-miss)2.
|
Fig. 2 (Mppmiss)2 spectrum after kinematic refit.
|
1II. Physikalisches Institut, Justus-Liebig-Universität Gießen
References
[1] F. Balestra et al., Nucl. Instr. Meth. A 426, 385 (1999)
[2] F. Hibou et al., Phys. Rev. Lett. 83, 492 (1999)
[3] R. Baldi et al., Phys. Lett. B 68 (1977) 381
[4] F. Balestra et al., Phys. Rev. Lett. 81, 4572 (1998)
[5] F. Balestra et al., Phys. Lett. B 468, 7 (1999)
[6] F. Balestra et al., Phys. Lett. B 491, 29-35 (2000)
[7] F. Balestra et al., Phys. Rev. C 63, 024004 (2001)
[8] D.E. Groom et al., Eur. Phys. J. C 15, 1 (2000)
IKH
05/31/01
© R. Dressler
|

