|
The monitoring of dose localization at carbon ion tumour therapy at GSI Darmstadt
by means of BASTEI [1] requires the comparison between the measurement and a
model calculation of the positron activity distributions [2]. For this a realistic description of the
positron range distribution in tissue is required. For that purpose a new model is
developed and an improved numerical implementation to the code is used.
Up to now the probability distribution of the positron emitter range is supposed to be a
bilinear exponential function [3] with three parameters depending on the maximum
positron energy.
These parameters have been estimated for b+-endpoint energies up
to 3.5 MeV, which is sufficient for PET applications to nuclear medicine.
However, in the nuclear fragmentation reactions between the therapeutic carbon ion
beam and the atomic nuclei of the tissue b+-emitters of much higher endpoint
energy (up to 16.7 MeV) are produced for which the parametrization of [3]
is not proved. Therefore, the positron range distributions have been
calculated by means of GEANT [4] simulations for all positron emitting isotopes
that may be produced by the fragmentation of 12C ions in tissue.
The geometry used in the GEANT calculations consists of an isotropic point-like
source in the centre of a water cube being sufficiently large for stopping all the
positrons.
The initial positron energy values were deduced from the b+-energy spectra.
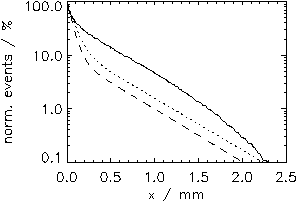
In Fig. 1 the projection of the 3D spatial distribution on an arbitrary oriented
axis (denoted with x) obtained by GEANT is compared with
those of Hasch [2] and Derenzo [3]. A much more realistic description of the
positron transport in the calculation of the b+-activity distribution
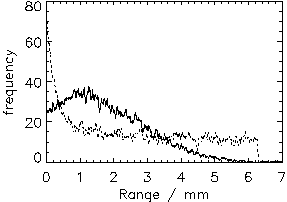
is expected if the 3D positron range distribution (Fig. 2) is applied.
Now the distribution function method is used for sampling the range values.
A cumulated distribution function (cdf) is constructed from the
positron range distribution, which was derived from the GEANT results.
The inverse function of cdf is stored in a lookup-table. This database is used
for the sampling of the random quantity positron range by means of chosing equally
distributed random numbers within the interval [0,1].

|
|

|
|
Fig. 1
Projected point spread function by Derenzo (dashed), Hasch (dotted) and GEANT
(solid) for 11C
|
|
Fig. 2
Positron range distribution of random quantities implemented by Hasch (dotted) and by GEANT
(solid) for 15O.
|
1 TU Dresden, Institut für Kern- und Teilchenphysik
References
[1] W. Enghardt et al., Annual Report 1999, FZR-271 (1999) 89
[2] B. G. Hasch et al., Annual Report 1996, FZR-179 (1997) 87
[3] S. E. Derenzo, IEEE Trans. on Nucl. Science, Vol. 33, No.1 (1986) 565
[4] GEANT-Detector Description and Simulation Tool, CERN Prog. Lib. W 5013 (1994)
IKH
06/25/01
© F. Pönisch
|

