| An X-ray CT Based Attenuation Correction Method for PET G | |||||
|---|---|---|---|---|---|
| F. Pönisch, W. Enghardt, K. Lauckner1 | |||||
|
As reported [1] a maximum likelihood algorithm was adapted for the
reconstruction of images from data taken by the limited angle double head camera
BASTEI at the heavy ion therapy facility of GSI Darmstadt. The necessary attenuation
correction algorithm differs from the one which is used in nuclear medicine.
The information on tissue composition and densities within the camera field of
view (FOV) are derived from X-ray computed tomograms (CT) which are taken for each patient
for treatment planning. Additionally, a CT of the head rest is used.
These two CT are automatically merged by means of our MERGECT IDL-code.
The correct positioning of these CT with respect to the positron camera is derived
from stereotactic coordinates used during the diagnostic CT scan and the tumour
irradiation with simultaneous PET measurement. The created data set contains all
information on the spatial distribution of matter within the
positron camera FOV and is the basis for the
calculation of attenuation correction factors.

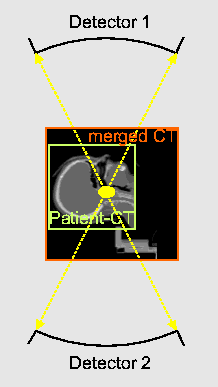
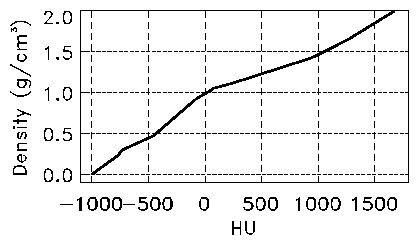
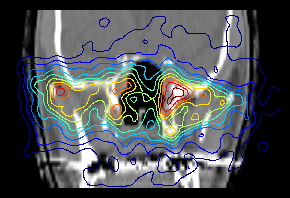
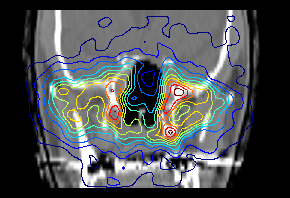
Fig. 1 PET detector with a sagittal slice of a patient and head rest extended CT. The Fig. 1 shows that there is a significant influence of absorption by the head rest on the detector response. The dashed lines denote the acceptance cone of the tomograph. By means of the HU-density calibration curve (Fig. 2) for a given Hounsfield unit (HU) the corresponding density is obtained. Due to the dependence of the mass attenuation coefficients on the tissue composition a segmentation of the HU range into air, soft tissue and bone is applied. The attenuation factors along each coincidence channel (4 millions) are calculated by a forward projection. From Fig. 3 the improvement is evident; whereas without attenuation correction spurious activity is observed inside the nasal cavity it is nearly completely removed after introducing the attenuation correction.

Fig. 2 Density-Hounsfield unit calibration curve from Zaers [2].
Fig. 3 Comparison of b+-activity distributions obtained without (left) and with (right) attenuation correction for a beam portal that is typical for treating skull base tumours. The beam enters the patient from the right side (left on the figure). The b+-activity isolines are superimposed onto X-ray CT. 1 Gesellschaft für Schwerionenforschung Darmstadt References
[1] K. Lauckner et al., Annual Report 1997, FZR-215 (1998) 70
|

