Comparison of First Results of K+ Production at ANKE with Model Calculations B

Ch. Schneider, H. Müller and ANKE Collaboration

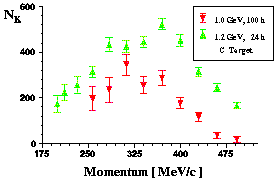
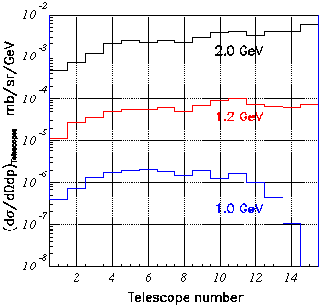
Kaon production in the reaction p+C®K++X has been measured with the ANKE spectrometer [1] at beam energies of 2.3, 1.8, 1.5, 1.2 and 1.0 GeV. The calibration of the data is still in progress, nevertheless the detected and analysed Kaon rates can be compared with the ROC-model [2] calculations if the acceptance and efficiency of the detection process at ANKE is taken into account. Thus the ROC-model was used as a data generator for GEANT simulations of the ANKE side detector system.

schneid11.gif

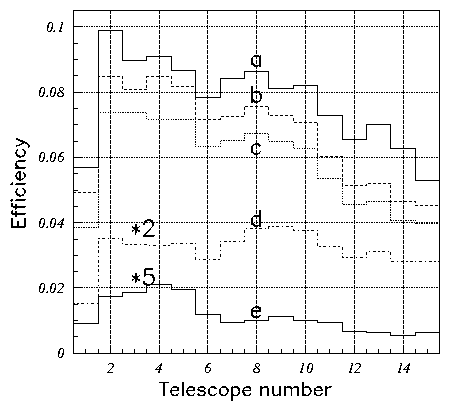
Fig. 1 Simulation of K+ verification with the ANKE side detector system as a function of telescope number. The curves are explained in the text.


In Fig. 1 the detection efficiencies for Kaons from such simulations are shown. They are plotted as a function of the telescope number, normalised to the total number of Kaons. Curve b shows the number of Kaons generated in the acceptance range of each considered telescope. The difference to the curve a represents the losses due to scattering and due to the gaps between the telescopes. Curve c takes into account the loss due to cuts on time of flight and energy loss in the scintillation counters. Curve d takes the lifetime of the Kaons on their way through the detector into acount. Curve e shows the finally counted particles in the veto counter with a decay time larger than 2.6 ns.
Very primilary results of the data analysis for beam energies of 1.0 GeV and 1.2 GeV are shown in Fig. 2. The raw numbers of extracted Kaons for the specified data collecting time are plotted as a function of the mean particle momentum measured in every telescope. A peliminiary normalisation to comparable experiment conditions results in a factor of ~ 30 [3] between the cross sections at the two energies. The cross sections obtained from the ROC-Geant simulations are plotted in Fig. 3. They take into account all losses described in Fig. 1. The ratio of the measured production rate at 1.0 GeV and 1.2 GeV at the covered forward angle around 0° is comparable to the prediction of our simulation.

schneid13.gif schneid12.gif

Fig. 2 Number of indetified Kaons in each telescope from the experimental runs at 1.2 and 1.0 GeV [1]

Fig. 3 Simulated detection cross sections, when the ROC-model is used as a generator for GEANT simulation of the ANKE spectrometer

References

[1]   S. Barsov et al., Nucl. Phys. A 675, 230 (2000)

[2]   H. Müller, Z. Phys. A 355, 223 (1996)

[3]   M. Büscher et al., publication in preparation


FZR
 IKH 05/31/01 © Christof Schneider