|
The control and data acquisition system of ELBE is a PC-based system using standard net technologies like e.g. OPC (Object Linking and Embeding (OLE) for Process Control) to interface the system components. The part of the system from which the diagnostics value are achieved is subdivided into two scopes of duties. The first is the section which acquires the raw data and processes the data (referred to as the DAQ/IMAQ). For this an example is: images from the beam distribution are grabbed from a VIDICON camera and vertical and horizontal profiles are extracted from the image data. The second is the section which processes the data in further steps to achieve more complex diagnostic variables and prepare indicators for the operator user interface (referred to as the diagnostic software). Whereas LabWindows is the development tool for the DAQ/IMAQ part for historical reasons, in general LabView will be used for the diagnostic software; it provides a well established link to LabWindows. The communication between these two system parts is realized through the DataSocket technology [1].

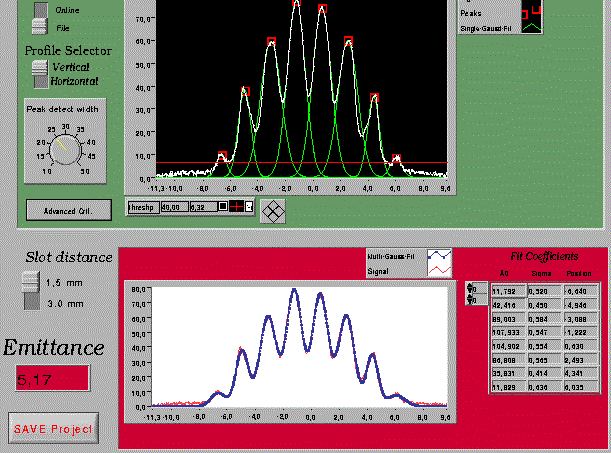
Fig. 1 Tool to determine the emittance by the multi slit methode One of the important tasks in the diagnostic is the control of the beam emittance. This is done in the injector part of the accelerator with two methods. One is the multi slit method which demonstrates what kind of requirements the diagnostic software has to fulfil. In the multi slit method parts of the beam are cut out by a slit mask and are recorded from a detection screen with a camera. From the Image acquisition system IMAQ the profile data are sent to the diagnostic software. Here the image profile is fitted by a multi Gaussian function and the emittance is calculated from the fit parameters (see fig. 1). Therefore the diagnostic software must provide complex signal analysing tools like the multi Gaussian fit and on the other hand support flexible operator controls and data indicators. In the tool displayed in fig. 1 it may be necessary to adapt the base line below the peaks or smooth the raw curve by an operator controlled width to find the correct number of peaks, which is a prerequisite for a successful multi Gaussian fit. Unlike in other development tools a graphic programming language is used in LabView. The basic philosophy is to reflect the measurement hardware and signal acquisition in the software through the so-called (graphic) virtual instruments (VI). In that way it is consistent to reflect the diagnostic tasks like emittance, energy spread, beam profile, beam positions measurements and so on into single VIs. Since partly identical (e.g. read image profiles) subtasks have to be fulfilled much the same basic VI or subVI can be used in the program development. The data transfer between the VIs (like to the DAQ/IMAQ) is consequently realised with the DataSocket technology.
References
[1] http://www.ni.com/datasocket/wp1680.pdf
|