The Magnetic Field of the Hybrid Undulator U27
In order to ensure sufficient overlap of the electrons with the optical beam, the center of the electron trajectory should be at the same position independently of electron energy and of the strength of the magnetic field. The principle of the magnetic structure of such a nearly "passive" undulator is shown in fig. 1. The structure consists of NdFeB permanent magnets and poles of decarborized iron. The field of these arrangement has been investigated by the code RADIA [1]. Corresponding results have been reported [2]. To ensure the correct slope and position of the electron beam at the undulator exit one has to add an additional magnet (m2) and an iron pole (p2) on either side producing appropriate fringe fields.
The undulator was adjusted for a gap g = 12 mm by varying the y-coordinate of p2 and the distance between m2 and p2 (see fig. 1). The resulting displacement and the slope of the trajectory at the exit can be corrected by coils mounted at the entrance sides of both sections and allowing to inject the electrons at a small angle to the z-axis.
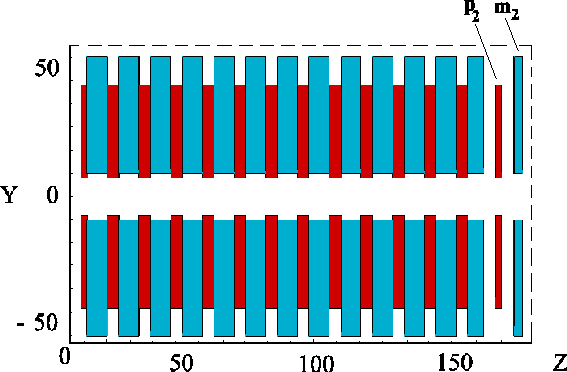
Fig. 1: Principle of the magnetic structure of U27. The blue rectangles represent NdFeB permanent magnets, the red ones show poles of decarborized iron. The symbols p2 and m2 denote poles and magnets of reduced thicknesses mounted at the same girder like the rest of the structure.
The undulator field was measured and tuned at HASYLAB (DESY) by means of the Hall probe as shown in fig. 2. After transporting the undulator to Rossendorf control mesurement of the undulator fields have been performed using the pulsed-wire method.
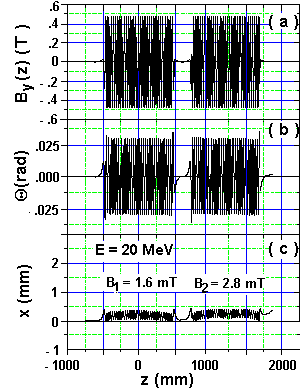
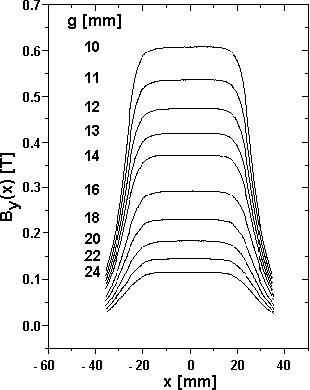
At DESY the probe was mounted on a goniometer with six degrees of freedom for right adjustment within the magnetic structures. The poles were tuned with the aim to get a minimum electron displacement at the exit sides of the modules as well as a peak field roughness lower than 0.4%. As a result of the measurements the fig. 3 shows the field component By(0,0,z) in the middle plane of both undulator units for a gap of g = 12 mm and a distance d = 250 mm between the sections (part a) and the first integral over the measured field (part b). The trajectory of a reference electron with an energy of E = 20 MeV in the wiggle plane is shown in part (c). Only weak magnetic fields of about 2 mT are necessary to keep the electrons within the optical mode. Fig.4 shows the magnetic field distribution By(x,0,z5) perpendicular to the electron beam at different gaps , where z5 is the z coordinate of the 5th pole.

Fig. 2: The Hall probe mounted on a goniometer for field measurements on the axis of one of the undulator sections.
|
|
|
|
In order to estimate the influence of the remaining field inhomogeneities on the lasing process, we determined for various gap widths the maxima (minima) Bi of the field, their average values Bav and the differences Bi - Bav. For g = 14 mm the results are shown in fig. 5. The standard deviations σB of the Bav contribute to the inhomogeneous line broadening of the emitted light corresponding to the following formula:
 |
(1) |
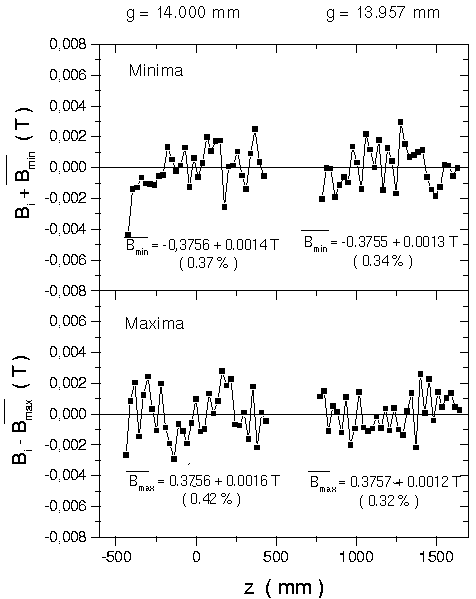
Fig. 5: Maxima and minima of the magnetic field By (z) in the middle plane of the whole undulator. For both sections the average values Bav and their standard deviations σ are denounced. The values σB/Bav characterizing the field roughness are given in parenthesis.
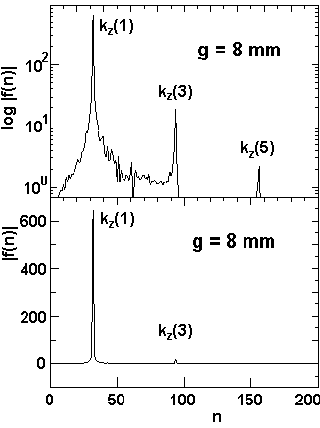
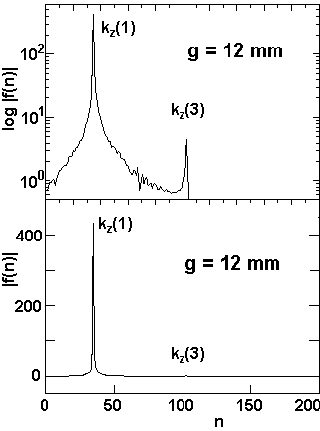
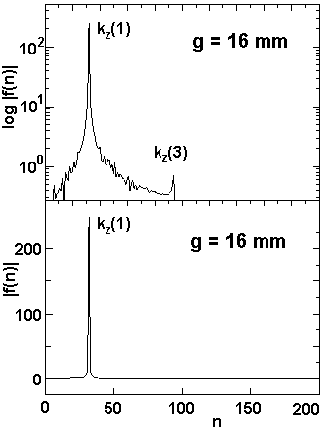
The fast Fourier transform obtained from the measured field distribution By(z) is shown in the fig. 6, which indicates for gap widths of g = 8, 12, 16 and 20 mm the absolute values |f(n)| of the contributions of the first, third and fifth harmonics to the magnetic field. The employed FFT - procedure delivers the wave numbers kz as a multiple of the quantity k0:
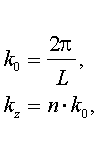
where L is the length (mm) of the interval used for the analysis. For each gap a window of 1690 points and a length of 885.0 mm was analysed containing 31 full magnetic periods. The quantity k0 has therefore the value k0 = 0.007099 mm-1. Since the momenta A3 in f(n) exhibit always a positive sign, the measured field By(z) is a bit more flat and more broad than a pure sine function. The reason for the appearence of higher harmonics is the width wz = 5 mm of the iron poles in z-direction, influencing the form of the field mostly for lower gap values.
 |
 |
|
 |
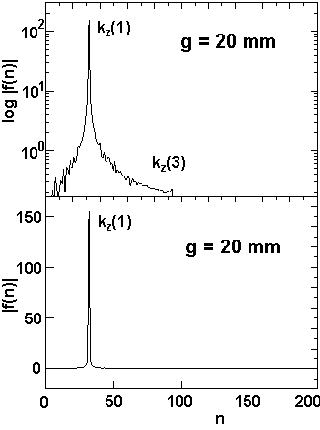 |
Fig. 6: The Fourier Transform (FFT) of the measured field distribution By(z) for various gap values
If the FEL works with maximum power the energy factor γ of the electrons decreases by dγ = γ/2 Nu (for the first harmonic) along the electron path due to the interaction of the electron beam with the electromagnetic field, where Nu = 68 is the total number of magnetic periods in the two undulator units. The electron energy changes continuously from the undulator entrance to the exit leading to a resonance wavelength λ(z) which depends on the coordinate z along the undulator
 |
(2) |
Within a certain interval dλ this effect can be compensated by differentially increasing the gap, and hence decreasing the magnetic field along the undulator. To compensate the energy loss dγ by a reduction dB of the magnetic field one has to ensure
 |
(3) |
from which follows
 |
(4) |
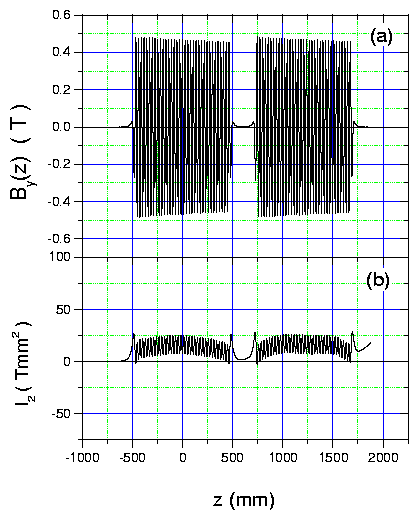
For hybrid undulators, the Halbach equation allows to estimate the tapering of the gap g needed for the variation dB of the field corresponding to equation (4). Figure 7 shows the effect of field tapering in both sections of the undulator U27, which would be used in a situation typical for high intensity lasing.
 |
|---|
|
Fig. 7: |
For variable gaps the radiation wavelength is changed and consequently the phasing between the two undulator systems has to be changed as well. This has to be done by properly choosing the electron flight path d between the two sections.
The optical phase in an undulator has been analyzed in detail by Walker [3]. It can be expressed by
 |
(5) |
Here z is the coordinate along the beam axis, λ is the radiation wavelength, γ is the electron kinetic energy in units of its rest mass and Θ is the electrons deflection angle. The terms in the bracket have the following descriptive meaning: the first gives the contribution to the phase, if the electron travels just a distance z in free space, the second term represents the additional contribution due to the magnetic field. The function Θ(z) can be derived from By(z) by
 |
(6) |
Using the eqs. (5) and (6) the phasing of the two undulator sub-systems can be determined experimentally by measuring By(z) along the axis of the entire undulator.
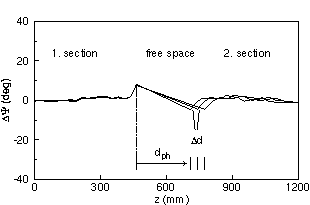
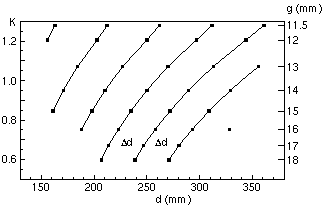
The phase on the poles in the second section varies with the distance d, which depends on the K-value and has to be chosen appropriately. Moreover, phase matching is obtained periodically after an increase of d by Δd = λu(1+Krms 2). The deviation of the optical phase angle from its nominal value obtained for a perfect undulator is denoted by ΔΨ(z). For a gap g = 17 mm measurements for ΔΨ(z) are shown in fig. 8. The K-value for this case was 0.6688. The nominal phase deviation on the poles is nearly zero, only at the end poles before and after the interspace the phases deviate from zero. The proper choice of the distances d as functions of the K-value as determined experimentally is shown in fig. 9. Six different curves have been measured. They are shifted horizontally by Δd = λu(1+Krms 2(g)). These curves have to be used to choose phasing distances dph in dependence on the gap g.
 |
 |
|
|
Fig. 8: Phase differences ΔΨ(z) for a gap g = 17 mm. The K-value is 0.6688. Three phasing distances dph are shown. |
Fig. 9: Phasing distances dph (points) between the two sections of U27. The right axis shows the gap widths g, for which the values dph have been found, the left axis shows the corresponding K-values in a linear scale. |
References
[1] P. Elleaume, O. Chubar and J. Chavanne, J. Synchr. Rad. 5 (1998) 481
[2] P. Gippner, W. Seidel and A. Schamlott, Annual Report 1998, FZD-271, p.16
[3] R. P. Walker, Nucl. Instr. Meth. A335 (1993) 328
