Coolant mixing in stationary flow regimes
This work was carried out in the frame of the project "Coolant mixing in pressurized water reactors" (registration number: 1501216) funded from 01.04.1998 to 31.05.2002 by the German Federal Ministry of Economics and Labour.
Background
Flow distribution in the primary circuit of pressurized water reactors is an important issue connected to different operational problems. For instance, the quasi-steady flow with macroscopic oscillating swirls inside the reactor pressure vessel can cause temperature fluctuations and therefore is of importance to long-term thermal fatigue. The flow distribution at the core inlet is influenced by the flow field in the reactor pressure vessel and the flow distribution between the loops. An asymmetric loop flow distribution is possible for example due to the pump operation uncertainties during power operation or due to the total pump failure during accident scenarios.
Asymmetric temperature distributions between the loops can occur during overcooling scenarios. Such overcooling scenarios are mainly connected with steam line breaks. Inadvertent opening of turbine valves or other valves in the secondary circuit of a NPP are characterized by the same consequences and phenomena. The mixing of the loop flows before the core inlet must be properly known in order to correctly predict the reactivity margin or the power excursion of the core.
Asymmetric temperature distributions between the loops can occur during overcooling scenarios. Such overcooling scenarios are mainly connected with steam line breaks. Inadvertent opening of turbine valves or other valves in the secondary circuit of a NPP are characterized by the same consequences and phenomena. The mixing of the loop flows before the core inlet must be properly known in order to correctly predict the reactivity margin or the power excursion of the core.
Boundary conditions for the ROCOM experiments
Experiments have been carried out with variation of the flow rates in the single loops between 0 and 160 % of the nominal flow rate.
The experiment with nominal flow rates in all loops is selected as an example. In that experiment, constant flow rates are set in all four loops corresponding to the nominal values. Tracer injection over several seconds simulating the overcooling is performed into the flow of loop N° 1.
The experiment with nominal flow rates in all loops is selected as an example. In that experiment, constant flow rates are set in all four loops corresponding to the nominal values. Tracer injection over several seconds simulating the overcooling is performed into the flow of loop N° 1.
Results
Coolant MixingFig. 1 shows the time evolution of the perturbation theta at both sensors in the downcomer (shown in an unwrapped view). Already at the upper sensor, a redistribution of the flow is observed. The sector with the tracer shifted from the inlet position of the loop (22.5°) to the sector corresponding to the share of the total flow (middle position now is 45°). The sector covered by the tracer is 90°, what confirms the quality of the boundary conditions (equal flow rates in all loops).
At the lower sensor, the tracer remains in the indicated sector, but fluctuations of the whole flow field are observed. They were confirmed by the velocity measurements (see below). Mixing with the ambient coolant takes places at the outer edges of the sector. At the core inlet, the tracer arrives at two positions at the border of the sector belonging to the corresponding loop at the same time. Only with growing time, the part in the middle of the sector is filled with tracer. After several seconds, the quasi-stationary concentration level establishes with a maximum in the middle of the sector (see video). At this quasi-stationary level, strong fluctuations of the tracer in the core inlet are observed. Vortices rotating in the downcomer plane (found in velocity measurements, see below) are responsible for the movement of the sector. Although the average and the maximum tracer concentration in the core inlet plane are nearly constant, at fuel element positions in the periphery of the affected sector, the tracer concentration changes significantly at the quasi-stationary level. This is demonstrated on Fig. 3, showing the measurement results including the confidence intervals determined on the basis of five single runs of the experiment. 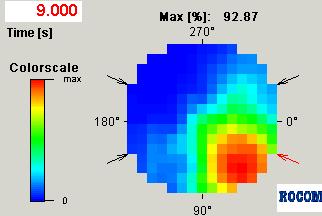 Fig. 2: Time evolution of the perturbation in the core inlet plane (avi-file) |
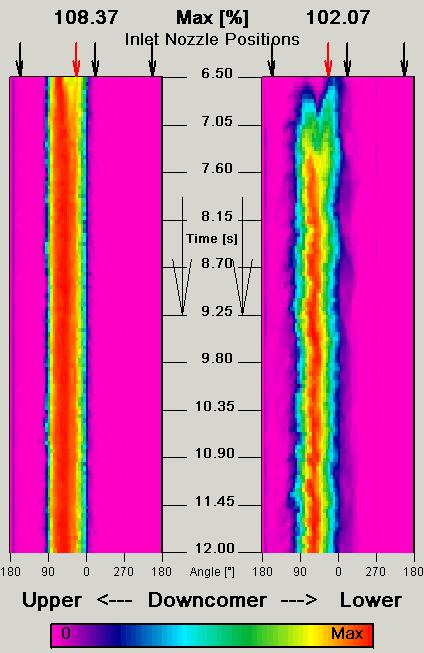 Fig. 1: Time record of the perturbation at the sensors in the downcomer (unwrapped view, the red arrow indicates the azimuthal position of the loop with tracer injection) |
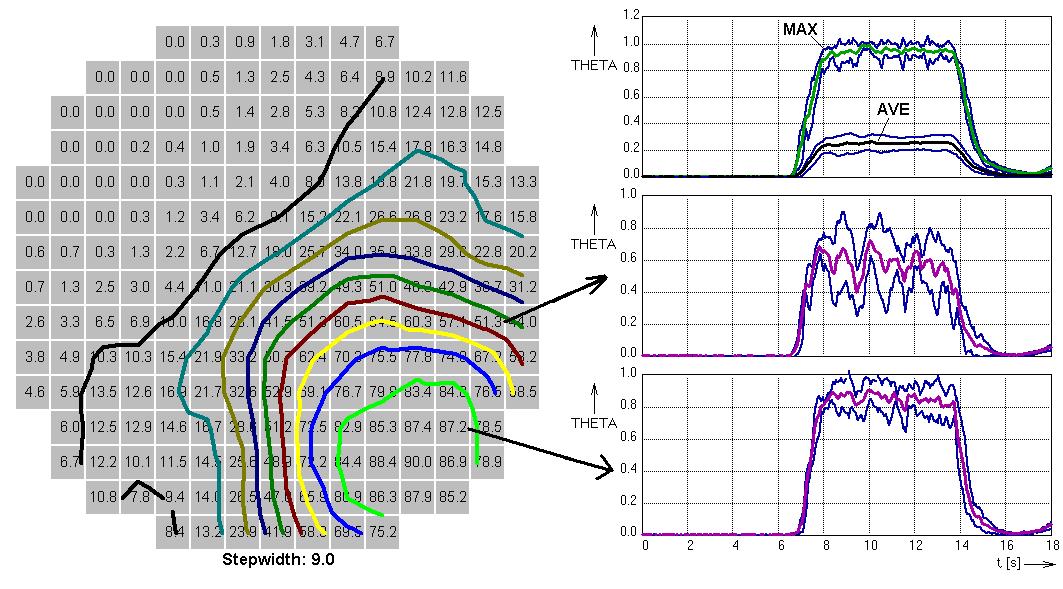
Fig. 3: Plateau averaged distribution of the perturbation in the core inlet plane (left) and time evolution of the perturbation at different positions in the core inlet plane including confidence intervals
Velocity distributionFig. 4 shows the measured by a laser Doppler anemometer vertical component of the velocity in the experiment with nominal flow rate in all four loops together with the confidence interval of 68.3 % (Negative values mean downwards directed flow!). It is clearly to be seen, that the velocity heavily depends on the measurement position on the circumference. At the positions 0 °, 90 °, 180 ° and 270 °, that means in the middle between two neighboring inlet or outlet nozzles, a maximum of the velocity is observed. Minima of the velocity are measured at the positions between the above mentioned angle positions (45 °, 135 °, 225 ° and 315 °). The non-uniformity of the velocity field at the outlet of the downcomer is caused by a group of eight recirculating swirls, forming up below the inlet nozzle region. The appearance of these secondary vortices is induced by the widening of the downcomer in the region below the inlet nozzles. The width of the downcomer is increased by the reduction of the wall thickness of the vessel. The resulting diffuser angle of 18 deg is too big to avoid flow separation.
|
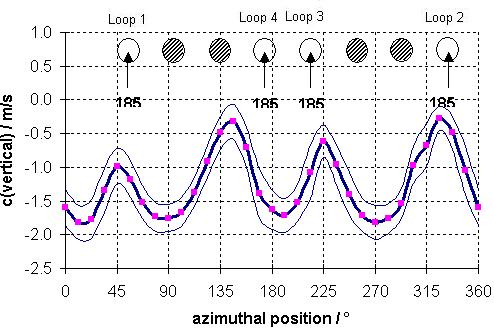 Fig. 4: Measured velocity in z-direction (along an azimuthal line at the outlet of the downcomer, negative values indicate downwards directed flow) |
Publications
- G. Grunwald, T. Höhne, H.-M. Prasser, F.-P. Weiss
Coolant Mixing in Pressurized Water Reactors at Constant Coolant Flow in the Primary Circuit
Proc. Annual Meeting on Nuclear Technology '00, pp. 109-114, INFORUM GmbH, Bonn (2000)
- T. Höhne, G. Grunwald, H.-M. Prasser
Experimental Investigations on the Four-Loop Test Facility ROCOM
Kerntechnik 65/5-6, pp. 212-215 (2000)
- G. Grunwald, T. Höhne, S. Kliem, H.-M. Prasser, K.-H. Richter, U. Rohde, F.-P. Weiss
Versuchsanlage ROCOM zur Untersuchung der Kühlmittelvermischung in Druckwasserreaktoren - Ergebnisse quasi-stationärer Vermischungsexperimente
Report FZD-348, ISSN 1437-322X, 92S., Rossendorf (2002)
- H.-M. Prasser, G. Grunwald, T. Höhne, S. Kliem, U. Rohde, F.-P. Weiss
Coolant mixing in a PWR - deboration transients, steam line breaks and emergency core cooling injection - experiments and analyses
Nuclear Technology, vol. 143 (1), pp. 37-56 (2003)
- H.-M. Prasser, T. Höhne, S. Kliem, U. Rohde, F.-P. Weiss
Untersuchung der Kühlmittelvermischung an der Versuchsanlage ROCOM - Experimente und Modellierung
Annual Meeting on Nuclear Technology '03, Proc. Topical Session: "Experimental and theoretical investigations on boron dilution transients in PWRs" pp. 57-83, INFORUM GmbH Berlin, (2003)