Analysis of hypothetical deboration transients
This work was carried out in the frame of the project "Development of methods for the analysis of accident scenarios with steam line breaks and boron dilution by the help of the code system ATHLET-DYN3D" (registration number: 1501225) funded from 01.07.2000 to 31.03.2004 by the German Federal Ministry of Economics and Labour.
Background
The underlying scenario is based on an unrecognised steam generator tube rupture. It is assumed, that a slug of unborated coolant has accumulated in the loop during outage, when the secondary side pressure was higher than that in the primary side. It is assumed further, that this deborated coolant is driven by switching-on the main coolant pump in the affected loop to the reactor pressure vessel and core inlet.
This hypothetical scenario was investigated in the frame of a parameter study with the following steps:
1. Calculation of the transient course of the boron concentration at the inlet into each fuel assembly for each initial slug volume between 0 and the bounding one of 36 m3 by the help of the semi-analytical mixing model SAPR (the stepwidth of the increasing is 4 m3).
2. Extraction of the core inlet distribution of the boron concentration at the time point of minimum.
3. Stationary core calculations by means of DYN3D
3.1 with the assumption, that the minimum value of the boron concentration is present in the whole reactor.
3.2 using the calculated core inlet distribution, but extending it over the whole height of the reactor.
4. Transient core calculations for the initial slug volumes, for which the stationary calculations showed a over-criticality (using the calculated by SAPR time-dependent boron concentration at the inlet into each fuel assembly).
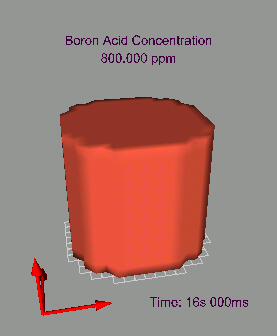
Fig. 2 shows the distribution of the boron concentration at the core inlet calculated by SAPR at the time point of minimum. As initial condition, the boron concentration in the lower plenum of the reactor was set to 2200 ppm and in the slug to 0 ppm.
These distributions were used as boundary conditions for the stationary core calculations (extended over the whole height of the reactor).
The calculated Keff-values for the reactor core are shown on Fig. 3. The use of the minimum boron concentration in the whole reactor leads of course to considerable higher Keff-values. From the calculations it follows, that under these conditions a recriticality of the core can be expected already for initial slug volumes between 8 and 12 m3, while for the conditions of a realistic distribution at the core inlet only between 12 and 16 m3.
In this case, the average boron concentration in the reactor core (Fig. 4) reaches only a minimum value of 1503 ppm about 20 s after switching-on the main coolant pump. The dynamic reactivity (Fig. 5) remains below the zero-line throughout the whole transient. The reactor becomes not critical, what is contrary to the stationary calculations presented above . That can be explained by the fact, that the slug has a finite length, what could not be taken into consideration in the stationary calculations, where the inlet distribution was extended over the whole height.
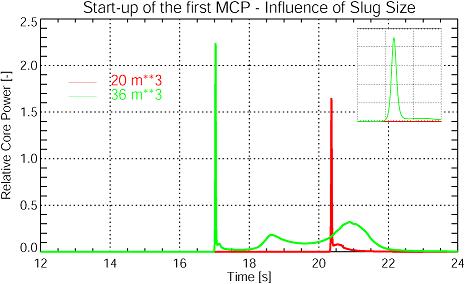
With an initial slug volume of 20 m3, the average boron concentration in the reactor core decrease to a value of less than 1400 ppm. This leads to a positive insertion of reactivity into the core, which not only compensates the intial sub-criticality, but leads also to a significant over-criticality of about 2 $. A corresponding power peak of about 1.7 times the nominal power (Fig. 6) is reached. Due to the prompt acting Doppler feedback, the further power increase is stopped, the half width of the peak is 23 ms. The insertion of energy into the fuel and the coolant during the peak is low, boiling did not occur. The compensation of the initial sub-criticality happens at about the time of the minimum of the boron content in the core. The following after the slug higher borated coolant transfers the reactor to a sub-critical state, again. The transient is finished.
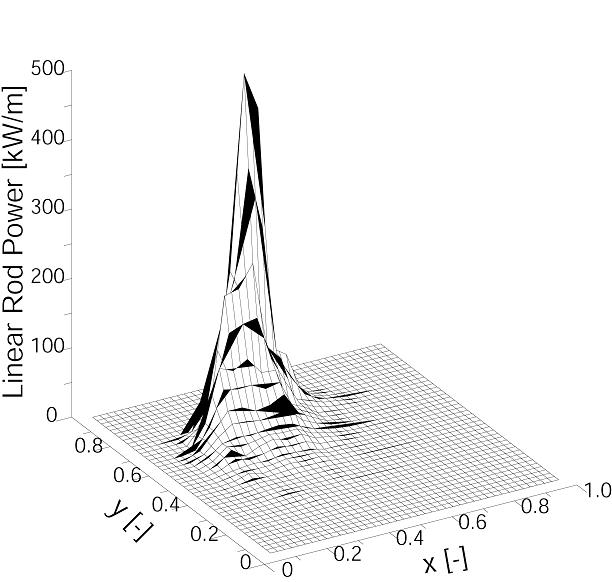
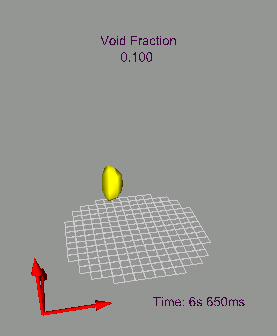
During the secondary power peaks, coolant boiling starts in single fuel elements, a maximum value of more than 70 % is reached. The animation in Fig. 9 demonstrates, again on behalf of an isosurface, how void appears in the upper part of single fuel elements and how the void is transported to the outlet of the core. This animation underlines the heterogeneous character of the transient, again. The critical heat flux density is not reached in these channels, the maximum inserted enthalpy does not reach any critical boundary value, too.
This hypothetical scenario was investigated in the frame of a parameter study with the following steps:
1. Calculation of the transient course of the boron concentration at the inlet into each fuel assembly for each initial slug volume between 0 and the bounding one of 36 m3 by the help of the semi-analytical mixing model SAPR (the stepwidth of the increasing is 4 m3).
2. Extraction of the core inlet distribution of the boron concentration at the time point of minimum.
3. Stationary core calculations by means of DYN3D
3.1 with the assumption, that the minimum value of the boron concentration is present in the whole reactor.
3.2 using the calculated core inlet distribution, but extending it over the whole height of the reactor.
4. Transient core calculations for the initial slug volumes, for which the stationary calculations showed a over-criticality (using the calculated by SAPR time-dependent boron concentration at the inlet into each fuel assembly).
Stationary core calculations
For the calculations, a generic equilibrium core-loading pattern of a pressurized water reactor containing 64 MOX fuel elements was used. The corresponding scheme is shown on Fig. 1. It is assumed, that the most effective control stays at fully withdrawn position.Fig. 2 shows the distribution of the boron concentration at the core inlet calculated by SAPR at the time point of minimum. As initial condition, the boron concentration in the lower plenum of the reactor was set to 2200 ppm and in the slug to 0 ppm.
These distributions were used as boundary conditions for the stationary core calculations (extended over the whole height of the reactor).
The calculated Keff-values for the reactor core are shown on Fig. 3. The use of the minimum boron concentration in the whole reactor leads of course to considerable higher Keff-values. From the calculations it follows, that under these conditions a recriticality of the core can be expected already for initial slug volumes between 8 and 12 m3, while for the conditions of a realistic distribution at the core inlet only between 12 and 16 m3.
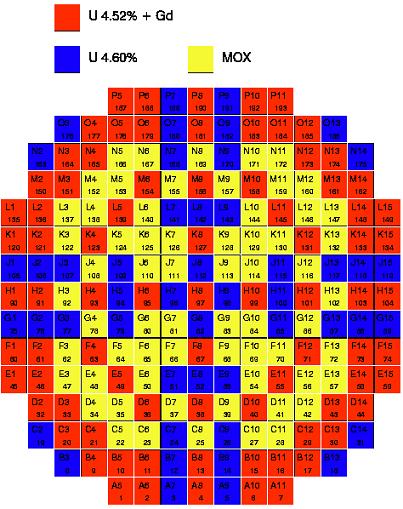 Fig. 1: Loading pattern of the generic reactor core used in the calculations |
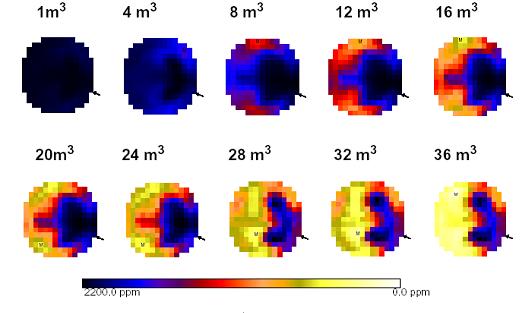 Fig. 2: Distribution of the boron concentration at the time point of minimum in dependance on the initial slug volume in the cold leg (calculated by SAPR) 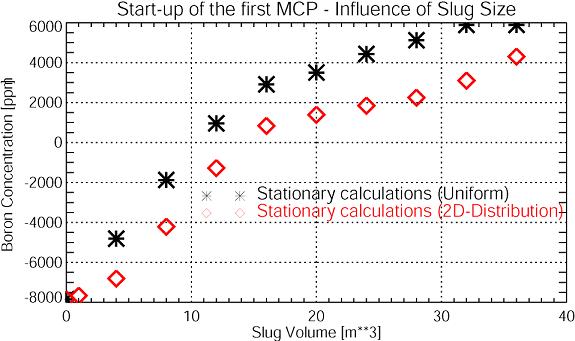 Fig. 3: Dependance of the stationary reactivity on the initial slug volume |
Transient core calculations
The stationary calculations showed, that only slug volumes greater than 12 m3 can lead to a recriticality of the switched-off reactor. Therefore, the first transient calculation was carried out for the initial slug volume of 16 m3.In this case, the average boron concentration in the reactor core (Fig. 4) reaches only a minimum value of 1503 ppm about 20 s after switching-on the main coolant pump. The dynamic reactivity (Fig. 5) remains below the zero-line throughout the whole transient. The reactor becomes not critical, what is contrary to the stationary calculations presented above . That can be explained by the fact, that the slug has a finite length, what could not be taken into consideration in the stationary calculations, where the inlet distribution was extended over the whole height.
With an initial slug volume of 20 m3, the average boron concentration in the reactor core decrease to a value of less than 1400 ppm. This leads to a positive insertion of reactivity into the core, which not only compensates the intial sub-criticality, but leads also to a significant over-criticality of about 2 $. A corresponding power peak of about 1.7 times the nominal power (Fig. 6) is reached. Due to the prompt acting Doppler feedback, the further power increase is stopped, the half width of the peak is 23 ms. The insertion of energy into the fuel and the coolant during the peak is low, boiling did not occur. The compensation of the initial sub-criticality happens at about the time of the minimum of the boron content in the core. The following after the slug higher borated coolant transfers the reactor to a sub-critical state, again. The transient is finished.
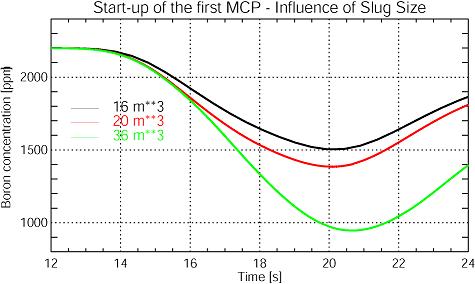 Fig. 4: Time history of the average boron concentration in the reactor core for initial slug volumes of 16, 20 and 36 m3 |
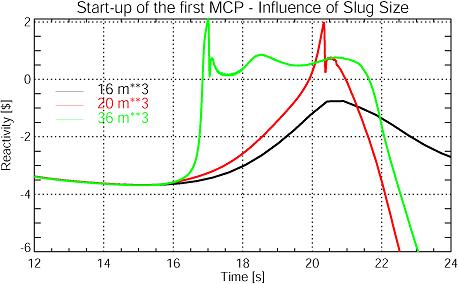 Fig. 5: Time history of the reactivity for initial slug volumes of 16, 20 and 36 m3 |
During the secondary power peaks, coolant boiling starts in single fuel elements, a maximum value of more than 70 % is reached. The animation in Fig. 9 demonstrates, again on behalf of an isosurface, how void appears in the upper part of single fuel elements and how the void is transported to the outlet of the core. This animation underlines the heterogeneous character of the transient, again. The critical heat flux density is not reached in these channels, the maximum inserted enthalpy does not reach any critical boundary value, too.
Publications
- S. Kliem, H.-M. Prasser, T. Höhne, U. Rohde
Development and application of a fast running model for the description of coolant mixing inside the pressure vessel of pressurized water reactors
Proc. Conf. on the Physics of Reactors PHYSOR 2002, Seoul, Korea, 6.-10.10.2002, CD-ROM, paper 5D-04 (2002) - S. Kliem, U. Rohde, F.-P. Weiss
Analysis of core behaviour after the entrance of underborated water
Annual Meeting on Nuclear Technology ‘03, Proc. Topical Session: Experimental an theoretical investigations on boron dilution transients in PWRs, pp. 85-96, INFORUM GmbH, Berlin (2003) - S. Kliem, U. Rohde, F.-P. Weiss
Core response of a PWR to a slug of under-borated water
Nucl. Eng. Desgin, vol. 230, pp. 121-132 (2004)
